Trading Strategy
What the market has actually done on the dates and events traders plan around: triple witching, options expiration, Fed decisions, earnings reactions, seasonality. Every piece is counted from the daily data, with the sources and the dates stated, and none of it is a prediction.
79 articles, newest first

NewOct 24, 2026 / 8 min read
Microsoft, Alphabet and Amazon Report October 28 and 29, Two Hours After the Fed: What Each Stock Did the Day After Every Report Since 2015
Microsoft and Alphabet report Wednesday, October 28, after the close, two hours after the Fed decision; Amazon follows Thursday. Since 2015 the day-after move has averaged 4.2%, 4.3% and 6.2% respectively, all three fade an opening gap more often than not, and the nine prior weeks with a Fed decision in the middle split five up, four down for the S&P 500.

NewOct 23, 2026 / 8 min read
Triple Witching Dates for 2026 and 2027, and What the S&P 500 Did on All 107 Triple Witching Days Since 2000
The 2026 dates are March 20, June 18, September 18 and December 18; the 2027 dates are March 19, June 17, September 17 and December 17, with the June expirations on Thursdays because of Juneteenth. On all 107 triple witching days since 2000, SPY closed higher 47.7% of the time on volume 1.23 times normal, and the reason raw data shows it falling almost every time is the dividend.

NewOct 21, 2026 / 8 min read
Tesla Q3 2026 Results: Flat Revenue, a Margin Rebound, Profit Down 56%, and What Tesla Stock Did the Day After Every Report Since 2011
Tesla reported $28.05 billion of revenue, $0.48 of adjusted EPS against $0.45 expected, an automotive gross margin back at 18.5% and operating income down 56% on AI spending. Thursday decides the reaction, so we measured the day after all 42 Tesla reports since 2011: median move 5.9%, up 45% of the time, the opening gap held through the close about half the time, and the first day's direction persisted for a week far more often than it reversed. What was reported, the record, and how to size the morning.

NewOct 21, 2026 / 8 min read
Super Micro Jumps 9.5% on a Preliminary $19 Billion Quarter: Every 10% Up Day in SMCI's History and What Came Next
Super Micro pre-announced September-quarter revenue of $18.5 to $19.5 billion against $14.5 to $15.5 billion guided, with margins above plan, and the stock closed up 9.5%. The full report is November 3. We measured all 91 days the stock rose 10% or more since its 2007 listing: the median next week was -1.1%, a month later +1.5%, and all ten of this year's were lower a week on. What the pre-announcement says, how this differs from January 2024, and how to hold a stock that gaps like this.

NewOct 21, 2026 / 7 min read
P&G Earnings on October 22, 2026: What to Expect, and What P&G Stock Did on Every Earnings Day Since 2010
Procter & Gamble reports Thursday, October 22 before the open, with Wall Street expecting about $22.8 billion of sales and core earnings down about 6% on higher costs. We matched all 67 of P&G's earnings reports since 2010 to the stock's move that day: a median of 2.6%, up 60% of the time, only 3 moves of 5% or more and none of 10%. The fiscal 2027 guide, the volume-versus-price question, every October report, and why a 2% down day on P&G has tended to keep drifting.

NewOct 20, 2026 / 8 min read
The Pre-Holiday Effect: What the S&P 500 Did the Day Before Every Market Holiday Since 1950
We found every market holiday since 1950, 650 of them, and measured the session before and after. The pre-holiday session averages +0.21% and rises 65% of the time, seven times an ordinary day, and the effect is still alive since 2010. Thanksgiving is the strongest, Presidents' Day the only loser, the day after is a coin flip, and the worst pre-holiday session on record was Christmas Eve 2018. What it should and should not change before November 26.

NewOct 20, 2026 / 8 min read
Intel Q3 2026 Earnings on October 29: What to Expect, and What Intel Stock Did the Day After Every Report Since 2010
Intel reports Thursday, October 29 after the close, up about 149% this year and 35% below its June high. We matched all 70 of Intel's earnings reports since 2010 to the stock's next-day move: a median of 4.1%, but 8.5% since 2024 with the stock falling after 8 of the last 11, a 26% drop in 2024 and a 23.6% gain this April. The guide, the three numbers that decide Friday, every October reaction, and why Intel's bad earnings days have tended to keep going.

NewOct 19, 2026 / 8 min read
The Turn-of-the-Month Effect: What the S&P 500 Did on the First Trading Day of Every Month Since 1950
We labeled all 19,319 S&P 500 trading days since 1950 by their position in the month. The first trading day averages +0.14% and rises 59% of the time; every day outside the four-day turn-of-the-month window averages +0.02%. Those four days are 19% of sessions and most of the market's gain. Which parts survived since 2000, which month's first day is strongest, the worst first days on record, and what it should and should not change.

NewOct 19, 2026 / 7 min read
GM Q3 2026 Earnings: The Beat, the $20B Buyback, the 6.8% Drop, and What GM Stock Did on Every Earnings Day Since 2011
Updated October 21: GM beat on revenue ($50.0B), EPS ($3.70 vs $3.60) and EBIT-adjusted ($4.1B), narrowed its full-year guide to $14.5 to $15.5B and approved a $20B buyback, and the stock fell 6.8% on the day, its biggest earnings-day drop since 2021. The original preview and the record of all 66 earnings days since 2011 follow.

Oct 18, 2026 / 7 min read
Best Trading Bots for the Crypto.com Exchange in 2026: Who Actually Connects, What It Costs, and the Two Quirks Every Bot Must Handle
Only the Crypto.com Exchange has a trading API, and not every bot platform still connects to it. The real options as of October 2026 with prices checked on each vendor's site (Cryptohopper, Bitsgap, Coinrule, JorgAI, self-hosted; 3Commas no longer lists it), the Trading-plus-IP-whitelist key setup, why fees come out of the coin, why stops have to live on the bot's servers, and how to decide.

Oct 18, 2026 / 7 min read
Best Trading Bots for Kraken in 2026: The Real Options, What They Cost, and the Permissions a Bot Key Needs
Kraken allows third-party bots and has no IP allow-list, so the choice is which kind of automation you want. The six real options as of October 2026 with prices checked on each vendor's site (3Commas, Cryptohopper, Bitsgap, Coinrule, JorgAI, self-hosted), the exact Kraken key permissions a bot needs, what Kraken's 0.80% entry-tier taker fee does to the math, and how to decide.

Oct 18, 2026 / 8 min read
Kraken vs Crypto.com vs Alpaca for Automated Crypto Trading: Fees and Spreads Measured at the Same Moment
JorgAI now runs crypto rules on Kraken, the Crypto.com Exchange and Alpaca. We lined up the three venues' published entry-tier fees (0.80%, 0.50% and 0.25% taker) and sampled the bid-ask spread on eight USD pairs at all three within the same ten seconds: the two exchanges under 4 basis points on every pair, Alpaca from 2 to 57. What a round trip costs on each, how the connections differ, and which fits which member.

Oct 18, 2026 / 8 min read
Stock Market Week Ahead, October 19 to 23, 2026: Netflix, GM, Tesla, Meta and P&G Report, and How Far Each Stock Moves When They Do
Updated October 21: GM beat and fell 6.8%; Netflix beat, cut its ad outlook and fell 5.3%. Five big reports in four days, a light data week and a silent Fed. We measured the next-day move after every earnings report since 2010 for all five: Netflix moves a median 9.2% (30 moves of 10% or more), Tesla 5.9%, Meta 5.6%, GM 3.5% and P&G 2.6%. The schedule with times, what each report turns on, the data releases, and how to size and hold through the week.

Oct 17, 2026 / 9 min read
Meta Q3 2026 Earnings on October 21: What the Stock Did After Every One of Its 57 Reports Since 2012
Meta reports after the close on Wednesday, October 21, with revenue expected near the top of its $61 to $64 billion guide and every eye on capex. We measured META's next-day move after all 57 quarterly reports since the 2012 IPO: median 5.6%, 17 moves of 10% or more, October reports down six years in a row, morning gaps that fade more often than they extend, and what big moves did in the month after. Plus how to hold or trade it without gambling.

Oct 17, 2026 / 8 min read
Crypto.com Exchange vs Alpaca for Automated Crypto Trading: Fees, Spreads and What Each API Allows
JorgAI now trades crypto on two venues. We put the measurable parts side by side: how each connects, what each API allows, the published entry-tier fees (Alpaca 0.25% taker, Crypto.com 0.50% taker), and bid-ask spreads on eight pairs sampled at both venues within the same ten seconds. Bitcoin and Ether were tight on both; the gap opened on smaller pairs. No verdict, just the numbers and who each fits.

Oct 16, 2026 / 9 min read
Fed Blackout Period Starts October 17: What the S&P 500 Did in the Two Weeks Before All 213 Fed Decisions Since 2000
The Fed goes quiet from October 17 to 29 ahead of its October 27-28 meeting. We measured the S&P 500 before, on and after every scheduled decision since 2000: the ten days before are an ordinary two weeks (60% up, same as any window), decision day is a coin flip with one-in-three odds of a 1% move, and 2026 has closed lower on all six decision days. What to do with that if you trade by rules.

Oct 15, 2026 / 8 min read
Gold Is 22% Below Its January Record: Every Gold Bear Market Since 2000 and How Long Each Took to Recover
Gold fell a third straight day on the hot CPI print, the strong dollar and 5% yields. We measured every drawdown in gold futures since 2000: 4 bear markets of 20% or more, a median 877 days from record to record, and 68% of all days spent at least 5% under water. Where the 2026 decline fits, and what ended the last four.

Oct 14, 2026 / 8 min read
Oracle Fell 9% and CoreWeave 16% on AI Debt Fears: Every 8% Oracle Drop Since 1986 and What Came 60 Days Later
The bond market, not earnings, took Oracle down 8.8% and CoreWeave 15.5% on October 14 as yields on AI debt jumped. We measured all 81 Oracle one-day drops of 8% or more since 1986: higher 60 days later about two times in three, with a median 11.3% gain, except the last four, which were all followed by lower prices.

Oct 14, 2026 / 8 min read
Chip Stocks Fell 4.5% on a Hot CPI Day While ASML Said Demand Will Outrun Its Factories Through 2028: What Happened After the Last 107 Chip Selloffs
A hot September CPI sent yields up and chips down 4.5% on October 14, the same morning ASML posted a record quarter and said AI demand will exceed its supply through 2028. We measured all 107 previous 4% chip selloffs since 2011: what followed, and why 2026 is already the most volatile year on record for the sector.

Oct 13, 2026 / 7 min read
September 2026 Retail Sales on October 15: What to Expect, and Why the Report Has Rarely Moved the S&P 500 in 308 Releases
The September retail sales report lands Thursday at 8:30 AM Eastern, one day after CPI. August jumped 1.2%; the consensus is 0.3%. We measured the S&P 500 on all 308 release days since 2000: a median 0.58% move, the same as any day, with direction split 157 to 150.

Oct 13, 2026 / 8 min read
TSMC Q3 2026 Earnings on October 15: A Record Quarter Is Already Known, So Here Is What TSM and Nvidia Did on All 39 Report Days Since 2017
TSMC reports Thursday at 2 AM Eastern with a record quarter already visible in its monthly sales and the stock 9% off its high. We measured TSM and Nvidia on all 39 report days since 2017: a median 3.1% move, up 24 of 39, and a sympathy move in Nvidia that is more reliable on the bad days.
Oct 12, 2026 / 10 min read
Slippage in Trading, Explained: What Causes It, How to Reduce It, and What We Measured on 61 Real Market Orders
Slippage is the gap between the price you expected and the price you got. Where it comes from, how to measure and reduce it, how much to assume in a backtest, and what 61 real market orders in our members' accounts actually paid: a median of zero, with one in ten paying more than 35 basis points.
Oct 12, 2026 / 11 min read
The Wash Sale Rule, Explained: The 61-Day Window, Substantially Identical Securities, IRAs, Crypto, and What It Means for Active Traders
Sell at a loss and buy back within 30 days and the loss is deferred, not deductible. How the 61-day window works, what substantially identical means, the IRA trap where the loss is gone for good, where crypto stands, and how often an automated account actually trips the rule, from our own data.

Oct 11, 2026 / 8 min read
Netflix Q3 2026 Earnings on October 20: What the Stock Did After Each of Its Last 39 Reports
Netflix reports after the close on October 20. We measured the stock the day after all 39 of its reports since 2017: a median 7.3% move, down 24 of 39, and a month-after pattern that answers the hold-or-sell question.
Oct 11, 2026 / 8 min read
Fed Meeting October 27-28, 2026: What Stocks Did After Every Pause (and Every Follow-Up Hike) Since 1994
The October 27-28 meeting is the first since the September hike, and futures price an 82% chance of a pause. We measured all 50 Fed meetings since 1994 that came right after a hike: the Fed paused at 20, hiked again at 30, and the S&P 500 was flat on the day either way. The months after a pause were better, except four times.

Oct 11, 2026 / 8 min read
Does the Stock Market Go Up During Earnings Season? Every Season Since 2000, and Why October Is Different
Q3 earnings season opens Tuesday with the banks. We measured all 107 S&P 500 reporting seasons since 2000: up 63% of the time, median +1.35%, no better than any other five weeks. Except October, up in 21 of 26 years with a median gain of 2.83%.

Oct 11, 2026 / 7 min read
Options Expiration October 16, 2026: What the S&P 500 Actually Does on Expiration Fridays
Friday, October 16 is the monthly options expiration, and the folklore says it is a wild day. We counted every expiration Friday since 2000: median move +0.04%, higher 52% of the time, fewer 1% days than average. The week around it is more interesting than the day.

Oct 9, 2026 / 9 min read
Hurricane Isaias and the Stock Market: What Stocks, Oil and Gasoline Did After 13 Gulf Hurricanes
Isaias lands tonight as a Category 3 with two-thirds of Gulf oil shut in. We measured every Category 3+ Gulf landfall since 2005: the S&P 500 rose the next day after 11 of 13, and gasoline futures fell after 9 of 13. The two exceptions flooded refineries.

Oct 9, 2026 / 5 min read
Brent Oil Above $100 (October 13 Close: $105.69): What the S&P 500 Did After Every Crossing Since 2007
Brent crude settled at $105.69 on October 13 and has held above $100 for two weeks while the S&P 500 sits within a percent of its record. In the three earlier crossings since 2007, oil kept rising and stocks were lower six months later. Why this one is different so far.

Oct 9, 2026 / 5 min read
JorgAI vs TradersPost in 2026: The Two-Subscription Problem, With Every Price Verified
TradersPost does not generate signals, so most people pay for it and for a TradingView plan that supports webhooks. We priced every working combination against JorgAI on October 9, 2026, and say plainly which one fits whom.

Oct 8, 2026 / 7 min read
What Happens After the S&P 500 Hits a Record High? Every All-Time-High Close Since 1950, Computed
The S&P 500 has closed at a record 1,511 times since 1950, 28 of them this year. A year after a record close the index was higher 75 percent of the time with a median gain of 11 percent, the same as any other day. The 2000, 2007 and 2022 peaks were records too. What the full history says about buying at all-time highs, and what it cannot say.

Oct 8, 2026 / 8 min read
Consumer Sentiment Fell to 46.3 in October 2026 While Stocks Sit at Records: What It Means
Four of the five lowest consumer sentiment readings since 1952 are from 2026, and Friday's preliminary October number is expected near 48. Stocks rose after every past sentiment trough, but every one of those troughs came in a bear market. This one arrives with the S&P 500 near a record high. Our own computation of what that history does and does not say.

Oct 7, 2026 / 6 min read
What Happens to Stocks After the Fed's First Rate Hike: Every Cycle Since 1994, and Where 2026 Fits
After the first hike of each Fed cycle since 1994 the S&P 500 fell a median 3.1% in the first month, was higher a year later in four of six cycles, and suffered at least a 7% drawdown every time. Three weeks into the 2026 cycle, none of it has happened yet.

Oct 7, 2026 / 7 min read
Bank Earnings October 13-14, 2026: JPMorgan Missed, Goldman Beat, Wells Fargo and Citi Fell. The Results, and What Comes Wednesday
The big banks reported October 13: JPMorgan missed on a $658 million securities loss, Goldman Sachs beat on a 72% jump in equities trading, Citigroup beat and still fell 5.6%, Wells Fargo's revenue came up short. The numbers, the closes, and what Bank of America and Morgan Stanley need to show Wednesday.

Oct 6, 2026 / 8 min read
Midterm Elections and the Stock Market: What 19 Elections Since 1950 Say About November 3, 2026
The S&P 500 has risen in the 12 months after all 19 midterms since 1950, median gain 14.5%. We ran the numbers ourselves, and found the one reason 2026 does not fit the pattern: the pre-election drawdown never happened.
Oct 5, 2026 / 8 min read
Fed Minutes, October 7, 2026: "Most" Officials Expected Another Hike by Year End. What the Minutes Said and How Markets Reacted
The September meeting minutes are out. Most participants expected one more rate hike in 2026, inflation risks were skewed to the upside, and oil, AI investment and tariffs were named. Stocks slipped 0.2%. The full read, point by point against our preview.

Oct 4, 2026 / 7 min read
September 2026 ISM Services PMI: 54.9, Prices at a Four-Year High, Employment Back Above 50 (Next Report November 4)
The September ISM Services PMI came in at 54.9 against a 55.1 forecast. Prices rose to 74.0, the highest since July 2022, while employment returned to 50.1. What the split means for the Fed, and the next report on November 4.
Oct 4, 2026 / 7 min read
Is the US in Stagflation? October 2026: GDP 2.2%, Inflation 3.7%, Hiring Near Zero, Next to the 1970s
Stagflation is high inflation with weak growth and rising unemployment. The October 2026 numbers: GDP growing 2.2%, CPI at 3.7% and rising, hiring down to 29,000 a month, unemployment 4.2%. Two of the three boxes are ticking. Which ones, and what to watch.

Oct 3, 2026 / 5 min read
Is the Stock Market Open on Columbus Day 2026? Yes, but Bonds, Banks, and Settlement Are Closed
Stocks trade a full session on Monday, October 12, 2026, while the bond market, banks, and settlement are closed. What that split does to a trading day, ten years of Columbus Day S&P 500 moves, and the rest of the 2026 holiday calendar.

Oct 3, 2026 / 6 min read
CPI September 2026: 3.7% Headline, Core 2.6%, Both Above Forecast (Released October 14)
The September 2026 CPI report is out: headline inflation 3.7% from a year earlier, up 0.6% on the month, and core 2.6%, both a tenth above forecast. Gasoline rose 9.1% and energy 5.2%. What the numbers say about the October 27-28 Fed decision and how the market reacted.

Oct 2, 2026 / 7 min read
Bad News, Rising Stocks: Why the Weak September 2026 Jobs Report Sent the Market Up
The economy added 29,000 jobs in September against forecasts near 90,000, unemployment rose to 4.2%, and stocks rallied. Why a weak jobs report lifted the market, the revision most coverage skipped, and when bad news stops being good news.
Sep 30, 2026 / 6 min read
October 2026 Stock Market Calendar: Every Date That Can Move Your Portfolio (Jobs, CPI, Earnings, Fed, GDP)
The September jobs report on Oct 2, CPI on Oct 14, bank earnings from Oct 13, the Fed on Oct 27-28, and GDP plus PCE on Oct 29, all verified against the agencies that publish them. What each means with the 10-year above 5%, and how to size around it.

Sep 27, 2026 / 9 min read
Earnings Season 2026 (Q3): Key Dates, What Analysts Expect, and the First Bank Results
Q3 2026 earnings season started October 8 and the banks reported October 13: JPMorgan missed on a securities loss, Goldman beat on a 72% jump in equities trading, Wells Fargo and Citi fell. Dates, what analysts expect, and why this quarter is different.

Sep 22, 2026 / 7 min read
Will the Fed Raise Rates Again in October? What to Watch Before the 27-28 Meeting
One more 2026 hike is penciled in; October 27-28 or December is the debate. What makes this meeting unusual (no dot plot), the data that decides it starting with September 30 PCE, and how to invest into the suspense.
Sep 22, 2026 / 7 min read
Is October a Bad Month for Stocks? What 76 Octobers Since 1950 Say
October owns the scariest crashes and several of the greatest bottoms. The actual seasonal data, why the month feels more dangerous than it measures, and the disciplined playbook for Q4's noisy start.
Sep 21, 2026 / 8 min read
Oil Near $100: How Oil Prices Actually Affect the Stock Market
Brent near $102 amid the Middle East conflict. The four channels oil uses to move stocks, which sectors win and lose, what history says about supply-driven oil shocks, and how disciplined investors handle headline weeks.

Sep 20, 2026 / 8 min read
Trump Meets Xi on September 24: How US-China Summits Move Stocks and How to Trade the Week
Trump hosts Xi in Washington September 24 with the tariff truce expiring November 10. What is on the table, which sectors swing hardest on US-China headlines, and how to trade summit week without gambling on the outcome.

Sep 20, 2026 / 7 min read
Government Shutdown Averted Until December 11: What Shutdowns Actually Do to Stocks
No shutdown on October 1: Congress passed a stopgap through December 11, 2026. What the history of 20 funding lapses says about stocks, why markets mostly shrug, and how to prepare for the December rerun.

Sep 19, 2026 / 8 min read
Warren Buffett Steps Down as Berkshire Chairman: 5 Lessons Everyday Investors Should Steal
Buffett, 96, handed the Berkshire chairman role to his son Howard on September 18, 2026, with Greg Abel staying CEO. The five things six decades of Buffett actually proved, and why none of them require being Buffett.

Sep 18, 2026 / 8 min read
Which Sectors Benefit From Rising Interest Rates? The History and the Mechanics
Banks, insurers, energy, and value stocks have historically held up when rates rise; growth, REITs, and bond proxies have struggled. The mechanics behind the patterns, their honest limits, and how traders use them without forecasting.

Sep 18, 2026 / 8 min read
The Fed Just Raised Rates to 4%: What the September 2026 Hike Means for Your Portfolio
The Fed hiked 25bps to 3.75-4% on September 16, its first increase since 2023, and the dot plot signals one more this year. Why stocks fell on an expected hike, what changed for cash, and the disciplined trader's response.
Sep 13, 2026 / 8 min read
The 10-Year Treasury Yield Is Near 5%: What It Means for Stocks
The 10-year Treasury yield climbed to the edge of 5% this week, a level seen briefly in 2023 and before that in 2007. Why yields are rising, what the number does to stock valuations, who benefits, and how traders handle a Fed-plus-witching week.

Sep 12, 2026 / 8 min read
Copy Trading Apps in 2026: How They Work, the Real Risks, and the AI Alternative
Copy trading apps mirror another trader's moves in your account. Here is how they actually work, the risks the marketing skips (you inherit a stranger's bad days), whether Robinhood supports it, and how rules-based AI automation differs.
Sep 12, 2026 / 8 min read
The Fed Dot Plot, Explained: A Trader's Guide to the September 2026 FOMC Decision
The Fed decides rates Wednesday, September 16, 2026 at 2 pm ET, and the updated dot plot may move markets more than the decision. What the dots mean, why this meeting is so uncertain, and how traders prepare.

Sep 11, 2026 / 7 min read
Why Is the Stock Market Down Today? How to Read Red Days in 2026
Five forces explain almost every market drop: yields, data surprises, earnings, geopolitics, and profit-taking. A two-minute routine to diagnose today's red day, and what to do (and not do) about it.

Sep 10, 2026 / 8 min read
How Much Do Day Traders Actually Make? The Honest 2026 Numbers
Fewer than 1% of day traders earn consistent profits, per the largest academic studies. Here is what the Taiwan and Brazil data really show, what the profitable minority looks like, and the honest math for 2026.
Sep 9, 2026 / 8 min read
Triple Witching on September 18, 2026: What It Is and How to Trade It Calmly
Triple witching hits September 18, 2026: index futures, index options, and stock options all expire at once. Here is what actually happens, why volume triples, and how rules-based traders stay calm.

Sep 4, 2026 / 7 min read
Good News, Falling Stocks: Why the Blowout August Jobs Report Sank the Market
The U.S. added 162,000 jobs in August 2026, triple the estimate, and stocks fell anyway. The good-news-is-bad-news paradox explained with today's live example, and the rules disciplined traders set for data days.

Sep 3, 2026 / 8 min read
Fed Rate Hike in September 2026? What It Would Mean for Stock Traders
Futures price meaningful odds of a September 2026 Fed rate hike after a divided July hold. How hikes hit stocks, what a hold would mean, and the rules disciplined traders set before September 16.

Aug 30, 2026 / 10 min read
How to Stop Revenge Trading With Rules Instead of Willpower
Revenge trading happens when judgment is worst, right after a loss. The fix is not more discipline in the moment, it is four rules decided in advance: a daily loss brake, fixed position size, exits at entry, and a written entry standard.

Aug 30, 2026 / 9 min read
The September Effect: Why September Is the Worst Month for Stocks (2026 Guide)
September is the only month with a negative long-run average return for the S&P 500. Here is what the September effect is, why it happens, what it cannot predict, and a five-step plan for trading a volatile month in 2026.
Aug 25, 2026 / 8 min read
How to Trade Nvidia Earnings Week Without Gambling Your Account
Nvidia reports Wednesday with PCE inflation the same morning. Here is how to handle a monster earnings week: expected moves, gap risk, and the three professional approaches that do not depend on predicting the number.

Aug 21, 2026 / 7 min read
How to Trade a Fed Rate-Cut Rally Without Chasing It
Jackson Hole put a September rate cut on the table and stocks are ripping. Here's how to trade a Fed rate-cut rally with discipline instead of chasing the pop and becoming the exit liquidity.

Aug 17, 2026 / 6 min read
I Followed My Trading Rules for 30 Days. Here's What Actually Changed.
I wrote my trading rules on one page and refused to break them for a month. The strategy was never the problem. Here is what thirty days of discipline actually taught me.

Aug 6, 2026 / 9 min read
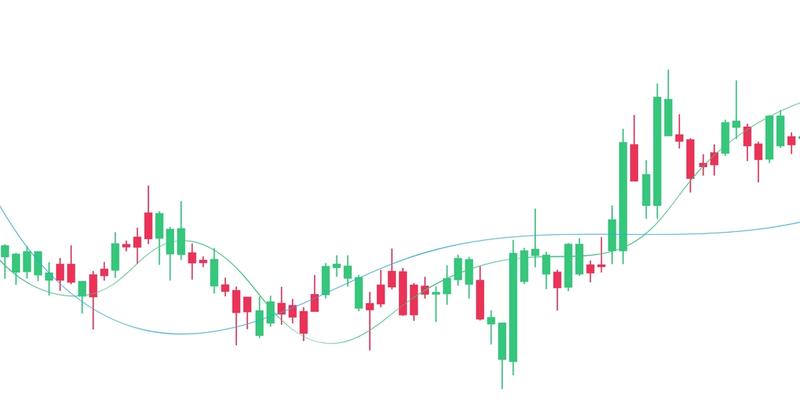
Technical Indicators Explained: RSI, MACD, and Moving Averages
Candlesticks show what price is doing. Indicators help you read it. A plain-language guide to moving averages, RSI, and MACD, what each measures, and where they mislead.

Jul 28, 2026 / 9 min read
How to Backtest a Trading Strategy Before You Risk Real Money
Never trade a strategy you have not tested. Here is how to backtest a trading strategy the right way, the metrics that actually matter, and the traps that make a backtest lie.

Jul 10, 2026 / 7 min read
The Revenge Trade Trap: How to Break the Emotional Loss Cycle
The single most expensive mistake in retail trading is not picking the wrong stock. It is the revenge trade you take after the wrong stock beats you.

Jul 10, 2026 / 7 min read
How to Build a Trading Watchlist That Actually Works
Most trading watchlists are noise disguised as strategy. Here is how to build one that produces actual trades instead of just consuming your attention.

Jul 10, 2026 / 7 min read
The Trader's Guide to Reading Volume: What Price Alone Cannot Tell You
Price tells you what happened. Volume tells you how much conviction was behind it. Learning to read both is one of the highest-leverage skills in trading.

Jul 10, 2026 / 8 min read
How Interest Rates Affect Your Portfolio (And Why You Should Care)
Interest rates are the tide that lifts or lowers every boat in the market. Understanding how they move your portfolio is one of the highest-leverage macro skills a trader can develop.
Jul 10, 2026 / 7 min read
The Case for Boring Trading Rules (Why the Best Traders Are Predictable)
The best traders are almost boring to watch. They do the same things, the same way, over and over. Here is why predictability beats brilliance in the long run.

May 10, 2026 / 9 min read
How to Trade Earnings Season: A Smart Trader's Playbook for 2026
Earnings season moves the market more than any other event. Here is how to trade before, during, and after earnings without getting caught on the wrong side, plus three setups that consistently have an edge.

Apr 30, 2026 / 12 min read
Why Most Traders Lose Money (And How to Be the 10% Who Don't)
Studies show 80-90% of retail traders lose money. The 10% who win share specific habits. Here is exactly what they do differently and how to join them.

Apr 22, 2026 / 9 min read
How Geopolitical Events Move the Stock Market and What Smart Traders Do About It
From the Iran ceasefire rally to trade wars and Brexit, geopolitical events can move billions in minutes. Learn the 5 mistakes traders make and how to protect your portfolio when headlines drive the market.

Apr 21, 2026 / 7 min read
Passive Income Stock Trading AI: How to Make Your Money Work While You Sleep
Learn how passive income stock trading AI works, what to look for in a platform, and how to get started automating your portfolio.

Apr 8, 2026 / 10 min read
Trading Psychology: How to Stop Emotions from Destroying Your Portfolio
Fear, greed, revenge trading, and FOMO destroy more portfolios than bad analysis ever will. Learn the 5 emotions that kill trading accounts and how to build a system that makes emotional decisions impossible.

Apr 6, 2026 / 8 min read
Investing During Market Volatility: 7 Tips Backed by Every S&P 500 Drawdown Since 1950
Seven tips for investing during volatile markets, each tied to a number we measured ourselves: 76 S&P 500 declines of 5% or more since 1950, 26 of 10% or more, 11 bear markets, and how long each took to heal. Updated October 14, 2026.

Apr 4, 2026 / 9 min read
7 Portfolio Metrics Every Trader Should Track (And Why Most Do Not)
Most traders have no idea if their strategy is actually working. Learn the 7 essential metrics that separate profitable traders from everyone else, and how to track them without spreadsheets.

Mar 28, 2026 / 10 min read
Day Trading vs Swing Trading: Which Strategy Is Right for You?
Day trading offers fast profits but demands full-time hours and $25K minimum. Swing trading is flexible and tax-efficient. Here is an honest comparison to help you choose.
JorgAI
Rules that run on every session, in your own brokerage account
Set the stop, the target, the per-trade cap and the daily loss limit once. The auto-trader applies them to every automated order, on the quiet days and the loud ones.
No performance promises. No black boxes. Just the mechanics of disciplined, automated trading.
Try JorgAI