Risk Management
The part of trading that decides whether you are still trading next year: where a stop should sit, how big a position should be, how long drawdowns have taken to recover, and what volatility readings have meant historically. Numbers first, rules of thumb second.
14 articles, newest first

NewOct 21, 2026 / 9 min read
The VIX, Explained: What It Measures, What a Normal Level Is, and What the S&P 500 Did After Every VIX Close Since 1990
The VIX is the market's price for the next 30 days of S&P 500 movement. We matched all 9,269 VIX closes since 1990 to the index and measured each level: how big the day's moves were, what the next month, quarter and year brought, the worst drawdown in between, how long all 25 spikes above 30 took to calm down, and how often the VIX overstated what followed. The size of moves it predicts well, the direction badly, and the year after a panic has usually been strong, after a rough quarter first.

Oct 15, 2026 / 9 min read
Lump Sum vs Dollar-Cost Averaging: We Tested Both on Every S&P 500 Window Since 1950
Invest it all today or spread it over a year? We ran both on every starting month in the S&P 500 since 1950: 910 twelve-month windows and 886 three-year windows. The lump sum won 72% and 81% of the time, DCA won almost only when the market fell, and the worst year for each is the mirror image of the other. How to decide for your own money.

Oct 14, 2026 / 10 min read
Maximum Drawdown, Explained: The Recovery Math, Every S&P 500 Drawdown Since 1950, and How to Set a Limit for Your Own Account
Drawdown is the drop from a peak to the next low, and the worst one is the number that makes people quit. We measured all 682 S&P 500 drawdowns since 1950: 26 reached 10%, 11 reached 20%, the index spends half its days at least 5% below its high, and a 10% drawdown takes a median 423 days from peak to new high. Plus the recovery math and how a limit becomes settings.

Oct 12, 2026 / 11 min read
Risk/Reward Ratio, Explained: The Break-Even Math, What 76 Years of S&P 500 Data Say About Two to One, and What Traders Actually Set
The risk/reward ratio sets the win rate you need to break even, but the ratio and the win rate are tied together. We ran eight target-and-stop pairs over 76 years of S&P 500 closes to show how often tight stops lose the race, then looked at the ratios real automated accounts actually set.
Oct 2, 2026 / 7 min read
Tesla Q3 2026 Deliveries Beat at 486,532: What It Means Before Earnings on October 21
Tesla delivered 486,532 vehicles in Q3 2026, about 24,500 above consensus, and the stock rose 5%. Why a delivery beat does not settle the October 21 earnings report, what to watch, and how to hold a stock through earnings without gambling.
Sep 30, 2026 / 7 min read
T-Bills Pay 4.9% and the 10-Year Is Above 5%: Should You Move Your Money Out of Stocks?
The 2-year note pays 4.88%, the 6-month bill 4.33%. We ran 40 years of S&P 500 returns against today's yields: stocks beat 5% in 26 of 40 years and lost money in 10. When bills win, when they do not, and the rules-based middle path.

Aug 30, 2026 / 11 min read
How to Automate Stop-Losses on Schwab, Alpaca, and Tradier
Attach the exit when you open the position, not after. How stop, stop-limit and trailing-stop orders work at each broker, why a stop is a trigger rather than a guaranteed price, and the failure modes that leave positions unprotected.

Aug 20, 2026 / 8 min read
How to Trade Stock Market Volatility Without Panic: A 2026 Fed-Week Playbook
Fed week, rate-cut bets, and AI repricing fears have markets swinging hard. Here's a calm, rules-based playbook for trading volatility in 2026 without letting emotion wreck your account.

Jul 10, 2026 / 7 min read
How to Cut Your Trading Losses Faster (The Cost of Hope)
The single most expensive habit in retail trading is hope. Every trader knows they should cut losses fast. Almost none actually do. Here is how to fix it.
Jul 10, 2026 / 7 min read
What Is a Trailing Stop and When to Use One
A trailing stop lets you lock in gains as a trade moves in your favor without capping the upside. Used right, it is one of the cleanest tools in a trader's kit.
Jun 5, 2026 / 9 min read
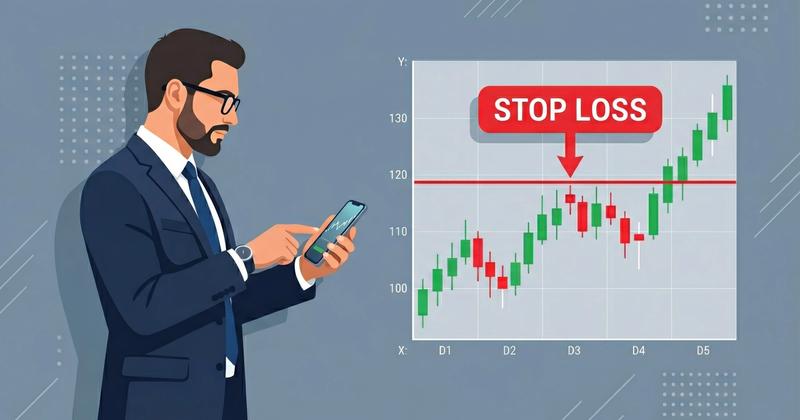
Stop Loss Strategies: How to Protect Your Trades Without Killing Your Wins
A stop loss that is too tight gets you knocked out by normal noise. One that is too loose lets small losses turn into account killers. Here is how to find the right balance.

Apr 21, 2026 / 7 min read
Is Automated Trading Safe? What Every Beginner Needs to Know
Learn the real risks of automated trading, the safeguards that matter, and how AI tools like JorgAI help beginners trade safely.

Apr 2, 2026 / 9 min read
Position Sizing: The One Skill That Separates Winning Traders from Losers
Two traders. Same strategy. Same win rate. Completely different returns. The difference is position sizing. Learn the formula professionals use and why most retail traders get it wrong.

Mar 15, 2026 / 6 min read
5 Risk Management Strategies Every Trader Should Know
Position sizing, stop-losses, trailing stops, circuit breakers, and daily spend limits. The essential risk controls that protect your capital and keep you in the game.
JorgAI
Rules that run on every session, in your own brokerage account
Set the stop, the target, the per-trade cap and the daily loss limit once. The auto-trader applies them to every automated order, on the quiet days and the loud ones.
No performance promises. No black boxes. Just the mechanics of disciplined, automated trading.
Try JorgAI