Blog / What Happens After the S&P 500 Hits a Record High? Every All-Time-High Close Since 1950, Computed
What Happens After the S&P 500 Hits a Record High? Every All-Time-High Close Since 1950, Computed

The S&P 500 closed at an all-time high of 7,818.93 on Monday, October 6, 2026, its 28th record close of the year. Two down sessions followed. If you are wondering whether a record high is a reason to buy, to sell, or to wait, here is what the full history says, measured rather than remembered.
We took every daily close of the S&P 500 from January 1950 through October 8, 2026, found every day that set a new all-time high, and measured what the index did 1, 3, 6 and 12 months later, plus the worst drawdown it suffered inside the following year. Then we compared those outcomes with every other trading day. The short answer: a record high is close to a non-event. Twelve months after a record close the index was higher 74.6 percent of the time with a median gain of 11.1 percent. Twelve months after any random day it was higher 74.6 percent of the time with a median gain of 10.7 percent. Record highs are not a sell signal and they are not a buy signal. They are a normal feature of a market that rises more often than it falls.
How common record highs are
Since 1950 the S&P 500 has set 1,511 record closes across 19,314 trading days, so about one day in thirteen is a record. They come in clusters: 92 percent of record closes were followed by another record within 31 days. Once the index is at a high, the most likely next event is another high, not a reversal.
The clusters sit inside long droughts. Twenty-seven of the 76 years since 1950 had no record close at all. The longest gaps between records ran from January 1973 to July 1980 (seven and a half years), from March 2000 to May 2007 (seven years), and from October 2007 to March 2013 (five and a half years). Anyone who bought at the last record before each of those gaps waited years to get back to even.
The busiest years were 1995 with 77 record closes, 1954 with 73, 2021 with 70, and 2017 and 1964 with 62 each. The recent run: 57 in 2024, 39 in 2025, and 28 so far in 2026, the first of them on January 6. By that count 2026 is an ordinary bull-market year, not an extreme one.
What the index did after a record close, versus any other day
All figures are S&P 500 price returns from the record close, no dividends, using calendar windows of 21, 63, 126 and 252 trading days. The comparison set is every trading day in the same period.
- One month later: after a record, median +0.7 percent, higher 60 percent of the time. After any day, median +1.1 percent, higher 62 percent of the time.
- Three months later: after a record, median +2.4 percent, higher 69 percent of the time. After any day, median +2.7 percent, higher 67 percent.
- Six months later: after a record, median +5.2 percent, higher 75 percent of the time. After any day, median +5.2 percent, higher 71 percent.
- Twelve months later: after a record, median +11.1 percent, higher 74.6 percent of the time. After any day, median +10.7 percent, higher 74.6 percent.
- Three years later: after a record, median +26.3 percent, higher 90 percent of the time. After any day, median +28.3 percent, higher 86 percent.
The first month is a touch weaker after a record, which fits the idea that a burst of buying gets digested. From six months on, the record-high days are as good as or slightly better than average on the probability of a gain, and about the same on the size of it. The common fear, that a record is where the next decline starts, does not show up in the aggregate.
How bad the drawdowns were
Returns are only half the question. The other half is how much you would have had to sit through. We measured the lowest close in the 12 months after each record and expressed it as a percentage below that record.
- Median worst drawdown in the year after a record close: 4.8 percent. After any day: 5.3 percent.
- A drawdown of 5 percent or more followed 49 percent of record closes.
- A drawdown of 10 percent or more followed 28 percent of record closes, versus 31 percent of all days.
- A drawdown of 20 percent or more followed 10 percent of record closes, versus 12 percent of all days.
So roughly one record high in four is followed by a 10 percent correction within a year, and one in ten by a bear market. That is the same risk you carry on any other day. The record did not add to it.
The records that were also the top
Averages hide the cases people actually remember. Four record closes in the last 26 years turned out to be the peak before a major decline, and they are worth seeing on their own:
- March 24, 2000: one month later -3.3 percent, twelve months later -24.5 percent, worst point -26.8 percent. The next record took seven years.
- October 9, 2007: one month later -5.7 percent, twelve months later -37.1 percent. The next record came in March 2013.
- February 19, 2020: one month later -28.8 percent, the fastest 30 percent decline on record, but twelve months later +15.6 percent. The next record came that August.
- January 3, 2022: one month later -4.3 percent, twelve months later -19.7 percent, worst point -25.4 percent. The next record came in January 2024.
None of those four looked different from the hundreds of records around them on the day they were set. That is the point. You cannot tell from the record itself whether it is the 1,200th of a run or the last one. Of the 1,476 record closes with a full year of data after them, 408 were followed by a decline of 10 percent or more. The other 1,068 were not.
Where 2026 fits
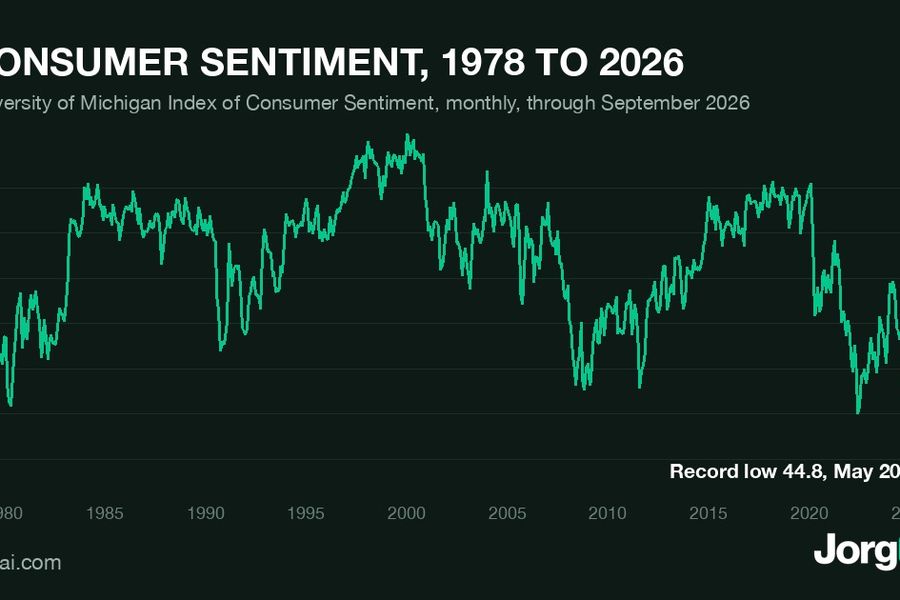
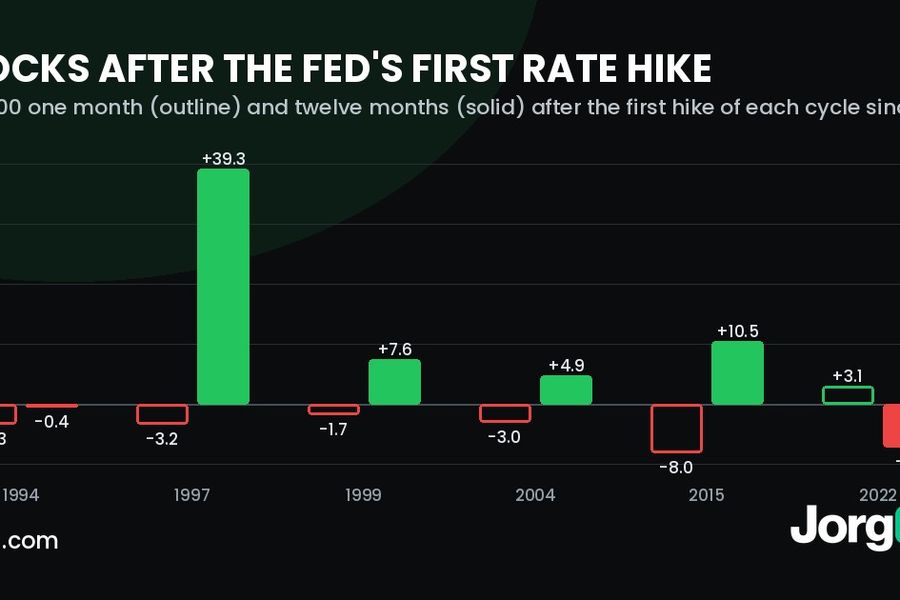
The October 6 record came with the index up about 14 percent for the year through Tuesday's close, three weeks after a Federal Reserve rate hike, with oil near $105 and consumer sentiment near a record low. We looked at two of those conditions separately: what stocks did after the first Fed hike of each cycle since 1994 and the unusual gap between record-low sentiment and record-high stocks. Neither history is a forecast. The record-high data above says the same thing: the level of the index is not information about its direction.
What is unusual about 2026 is not the number of records but the backdrop. Our Q4 2026 outlook covers the scheduled risks between here and year end, and the midterm election history covers the seasonal pattern that starts in November.
What to do with this if you trade
Three conclusions follow from the numbers, and none of them is a prediction.
- Waiting for a pullback because the market is at a high has no statistical support. The next-12-month distribution from a record is the same as from any other day. If your plan is to add money on a schedule, a record high is not a reason to break it; the dollar-cost averaging approach exists for exactly this problem.
- A record high is also not a reason to stop managing risk. One in four records is followed by a 10 percent drop within a year, and one in ten by a 20 percent drop. A stop-loss order placed when you enter, and a position size that keeps the planned loss small, matter at a record exactly as much as anywhere else. We covered the sizing math in how to automate stop-losses.
- The useful question is not "is this the top" but "what will I do if it is." A rules-based approach answers that in advance: entries by signal, exits by stop and target, size by risk, every decision logged with its reason. That removes the record-high anxiety from the process entirely. If you want to see what that looks like on real prices before risking anything, start with the free setup.
For the mechanics of letting software run those rules in your own brokerage account, see how to automate stock trading without coding, or set up a strategy and watch it work through the next record, or the next correction, whichever comes first.
Common questions
Is it bad to buy stocks at an all-time high?
Historically, no. Twelve months after an S&P 500 record close the index was higher about 75 percent of the time with a median gain of 11 percent, essentially identical to buying on any other day. The exception cases (2000, 2007, 2022) were real, but they were not identifiable from the record itself.
How often does the S&P 500 hit a record high?
About 7.8 percent of trading days since 1950, 1,511 record closes in total. They cluster: 92 percent of records were followed by another within a month. Twenty-seven of the 76 years had none.
How many record highs has the S&P 500 set in 2026?
Twenty-eight through October 8, 2026, the latest on October 6 at 7,818.93. That compares with 39 in 2025, 57 in 2024 and 70 in 2021.
Sources, checked October 8, 2026: S&P 500 daily closing prices from Yahoo Finance (ticker ^GSPC), January 3, 1950 through October 8, 2026; all return, drawdown and frequency figures are our own computation on that series and are price-only, excluding dividends. Investor.gov glossary for the dollar-cost averaging and stop-loss definitions. This article is educational and is not financial advice.
Keep reading
Let the AI do the trading.
Set it up in minutes. 7 day free trial on Starter and Pro.
Get started free